Digia
5.86 EUR -0.34%7,164 investors are following this company
Digia is an IT consulting company. The company specializes in system integration, web analysis, and internal processes that concern efficiency and decision management. The company's services are used in a number of sectors, from the financial sector to the grocery trade and the energy sector. The largest presence in the Nordic domestic market. Digia is headquartered in Helsinki.
P/E (24e)
10.82
EV/EBIT (adj.) (24e)
8.58
EV/S (24e)
0.85
Dividend yield-% (24e)
3.24 %
Target price
6.40 EUR
Recommendation
Accumulate
Updated
9.5.2024
NASDAQ Helsinki
DIGIA
Daily low / high price
5.86 / 5.96
EUR
Market cap
157.19M EUR
Turnover
8.31K EUR
Volume
1.4K
Business risk
Valuation risk
Current
Previous
Analyst

Joni Grönqvist
Analyst
Latest videos
Financial calendar
Interim report
2024-08-09
Business review
2024-10-25
Major OwnersSource: Millistream Market Data AB
| Owner | Capital | Votes |
|---|---|---|
| Ingman Development Oy Ab | 29.5 % | 29.5 % |
| Etola Oy | 12.8 % | 12.8 % |
Premium
This content is for our Premium customers only.
Insider Transactions
| Insider | Date | Total value |
|---|---|---|
| Robert Ingman | 2024-05-14 | 2,948EUR |
| Robert Ingman | 2024-05-14 | 1,130EUR |
Premium
This content is for our Premium customers only.
Income statement
| 2020 | 2021 | 2022 | 2023 | 2024e | 2025e | 2026e | 2027e | |
|---|---|---|---|---|---|---|---|---|
| Revenue | 139.0 | 155.9 | 170.8 | 192.0 | 201.6 | 208.2 | 215.5 | 222.0 |
| growth-% | 5.5 % | 12.1 % | 9.5 % | 12.5 % | 5.0 % | 3.3 % | 3.5 % | 3.0 % |
| EBITDA | 20.2 | 22.2 | 19.8 | 21.1 | 23.9 | 25.3 | 26.3 | 26.5 |
| EBIT (adj.) | 16.0 | 17.7 | 15.9 | 17.1 | 19.9 | 21.2 | 22.5 | 20.6 |
| EBIT | 14.1 | 14.7 | 12.7 | 13.8 | 16.9 | 18.4 | 20.1 | 20.6 |
| Profit before taxes | 13.5 | 14.6 | 12.1 | 12.4 | 15.1 | 17.3 | 19.6 | 20.6 |
| Net income | 10.6 | 11.8 | 9.6 | 9.9 | 12.1 | 13.9 | 15.7 | 16.5 |
| EPS (adj.) | 0.47 | 0.55 | 0.48 | 0.47 | 0.54 | 0.60 | 0.66 | 0.62 |
| growth-% | 48.3 % | 18.3 % | -13.3 % | -2.7 % | 16.2 % | 10.9 % | 9.3 % | -6.1 % |
| Dividend | 0.15 | 0.17 | 0.17 | 0.17 | 0.19 | 0.21 | 0.22 | 0.31 |
| Dividend ratio | 37.8 % | 38.6 % | 47.4 % | 46.2 % | 42.1 % | 40.6 % | 37.6 % | 50.0 % |
Profitability and return on capital
| 2020 | 2021 | 2022 | 2023 | 2024e | 2025e | 2026e | 2027e | |
|---|---|---|---|---|---|---|---|---|
| EBITDA-% | 14.5 % | 14.2 % | 11.6 % | 11.0 % | 11.9 % | 12.1 % | 12.2 % | 11.9 % |
| EBIT-% (adj.) | 11.5 % | 11.3 % | 9.3 % | 8.9 % | 9.9 % | 10.2 % | 10.4 % | 9.3 % |
| EBIT-% | 10.1 % | 9.4 % | 7.5 % | 7.2 % | 8.4 % | 8.8 % | 9.3 % | 9.3 % |
| ROE | 18.7 % | 18.3 % | 13.8 % | 13.5 % | 15.3 % | 15.9 % | 16.2 % | 15.4 % |
| ROI | 16.7 % | 15.9 % | 12.7 % | 12.8 % | 15.0 % | 15.7 % | 18.0 % | 19.3 % |
Valuation
| 2020 | 2021 | 2022 | 2023 | 2024e | 2025e | 2026e | 2027e | |
|---|---|---|---|---|---|---|---|---|
| Share price (EUR) | 7.52 | 7.04 | 5.71 | 5.40 | 5.86 | 5.86 | 5.86 | 5.86 |
| Shares | 26.8 | 26.7 | 26.7 | 26.8 | 26.8 | 26.8 | 26.8 | 26.8 |
| Market cap | 201.7 | 188.2 | 152.4 | 144.8 | 157.2 | 157.2 | 157.2 | 157.2 |
| Enterprise value | 212.2 | 198.8 | 170.0 | 169.6 | 171.1 | 159.7 | 147.6 | 135.0 |
| EV/S | 1.5 | 1.3 | 1.0 | 0.9 | 0.8 | 0.8 | 0.7 | 0.6 |
| EV/EBITDA | 10.5 | 9.0 | 8.6 | 8.0 | 7.1 | 6.3 | 5.6 | 5.1 |
| EV/EBIT (adj.) | 13.3 | 11.2 | 10.7 | 9.9 | 8.6 | 7.5 | 6.6 | 6.5 |
| EV/EBIT | 15.0 | 13.5 | 13.4 | 12.3 | 10.1 | 8.7 | 7.3 | 6.5 |
| P/E (adj.) | 16.1 | 12.7 | 11.9 | 11.6 | 10.8 | 9.8 | 8.9 | 9.5 |
| P/E | 19.0 | 16.0 | 15.9 | 14.7 | 13.0 | 11.3 | 10.0 | 9.5 |
| P/B | 3.3 | 2.8 | 2.1 | 1.9 | 1.9 | 1.7 | 1.5 | 1.4 |
| P/S | 1.5 | 1.2 | 0.9 | 0.8 | 0.8 | 0.8 | 0.7 | 0.7 |
| Dividend yield | 2.0 % | 2.4 % | 3.0 % | 3.2 % | 3.2 % | 3.6 % | 3.8 % | 5.3 % |
| Equity ratio | 50.2 % | 47.6 % | 44.4 % | 44.9 % | 48.5 % | 50.7 % | 62.6 % | 64.2 % |
| Gearing ratio | 17.3 % | 15.7 % | 24.8 % | 32.8 % | 16.7 % | 2.8 % | -9.4 % | -19.8 % |
Quarter data
| Q2/23 | Q3/23 | Q4/23 | 2023 | Q1/24 | Q2/24e | Q3/24e | Q4/24e | 2024e | |
|---|---|---|---|---|---|---|---|---|---|
| Revenue | 47.8 | 41.0 | 53.2 | 192.0 | 53.6 | 51.2 | 43.6 | 53.1 | 201.6 |
| EBITDA | 4.6 | 4.5 | 6.1 | 21.1 | 6.5 | 5.9 | 5.2 | 6.4 | 23.9 |
| EBIT | 2.7 | 2.7 | 4.3 | 13.8 | 4.8 | 4.1 | 3.4 | 4.6 | 16.9 |
| Profit before taxes | 2.4 | 2.4 | 3.7 | 12.4 | 4.3 | 3.7 | 3.0 | 4.2 | 15.1 |
| Net income | 1.9 | 1.9 | 3.1 | 9.9 | 3.4 | 2.9 | 2.4 | 3.4 | 12.1 |
ShowingAll content types
Digia Oyj: Digia Plc's Business Review January-March 2024 (unaudited)
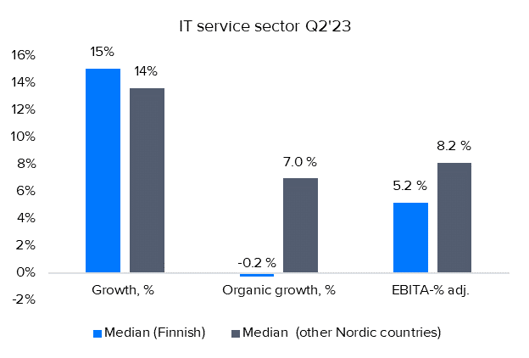
IT service sector: Our expectations for 2024 generally at the lower end of companies' guidance
Join Inderes community
Don't miss out - create an account and get all the possible benefits
Inderes account
Followings and notifications on followed companies
Analyst comments and recommendations
Stock comparison tool & other popular tools
Digia Oyj: The decisions of Digia Plc's Annual General Meeting 2024 and the organising meeting of the company's Board of Directors

Q4 IT service sector summary: Growth and profitability in line with our expectations, 2023 can be seen as a defensive win
Digia Oyj: Digia Plc's annual reporting package 2023 published
Digia Oyj: Digia Plc Financial Statement Bulletin 2023 (unaudited)
Digia Oyj: Notice of Digia Plc's Annual General Meeting 2024
IT service sector valuation levels at the bottom of our 7-year monitoring history, justifiably?
Digia Oyj: Digia Plc: Notification of changes in the company's ownership in accordance with Chapter 9 Section 10 of the Finnish Securities Market Act
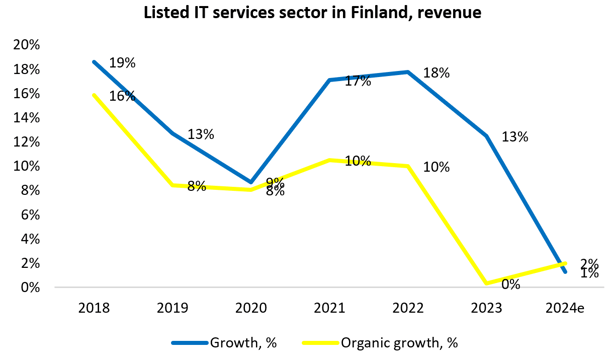
We expect the IT services sector to grow moderately and profitability to increase slightly in 2024
IT services sector Q3 summary: Better than feared with several areas continuing to perform well
Digia Oyj: Digia Plc's Business Review January-September 2023 (unaudited)
Digia Oyj: Digia's Financial Calendar and Annual General Meeting in 2024