Orthex
6.7 EUR -0.3%4,263 investors are following this company
Orthex is a Finnish manufacturer and supplier of household products. The company offers a range of products such as plastic boxes for storage, cutting boards, pots, bowls, and other accessories for the kitchen. Most of the range is accessed digitally via the company's e-commerce platform, and the products are offered via licensed resellers. The largest operations are in the Nordic market.
P/E (24e)
14.88
EV/EBIT (adj.) (24e)
11.37
P/B (24e)
3.07
Dividend yield-% (24e)
3.73 %
Target price
7.20 EUR
Recommendation
Accumulate
Updated
16.5.2024
NASDAQ Helsinki
ORTHEX
Daily low / high price
6.64 / 6.76
EUR
Market cap
118.98M EUR
Turnover
42.6K EUR
Volume
6.4K
Business risk
Valuation risk
Current
Previous
Latest research
Extensive report
Inderes' extensive report is an investor's handbook on customer companies covered by our research.
The latest extensive report was released
Read the reportAnalyst

Thomas Westerholm
Analyst
Latest videos
Financial calendar
Interim report
2024-08-22
Half year dividend
2024-10-01
Interim report
2024-11-15
Major OwnersSource: Millistream Market Data AB
| Owner | Capital | Votes |
|---|---|---|
| Conficap Oy | 14.0 % | 14.0 % |
| Rosenlew Alexander | 11.5 % | 11.5 % |
Premium
This content is for our Premium customers only.
Insider Transactions
| Insider | Date | Total value |
|---|---|---|
| Hans Cronquist | 2024-05-16 | 4,732EUR |
| Nicholas Ledin | 2024-05-16 | 4,250EUR |
Premium
This content is for our Premium customers only.
Forum updates
Income statement
| 2020 | 2021 | 2022 | 2023 | 2024e | 2025e | 2026e | 2027e | |
|---|---|---|---|---|---|---|---|---|
| Revenue | 75.9 | 88.7 | 84.0 | 85.9 | 91.1 | 97.7 | 104.5 | 110.8 |
| growth-% | 14.2 % | 16.9 % | -5.2 % | 2.2 % | 6.0 % | 7.2 % | 7.0 % | 6.0 % |
| EBITDA | 16.5 | 13.2 | 9.2 | 14.9 | 16.1 | 18.3 | 19.7 | 20.8 |
| EBIT (adj.) | 12.9 | 10.9 | 5.4 | 10.0 | 11.9 | 13.9 | 15.3 | 16.3 |
| EBIT | 12.3 | 9.3 | 5.2 | 10.8 | 11.9 | 13.9 | 15.3 | 16.3 |
| Profit before taxes | 9.9 | 7.7 | 3.0 | 8.5 | 10.2 | 12.4 | 14.0 | 15.3 |
| Net income | 7.7 | 6.0 | 2.1 | 6.9 | 8.0 | 9.8 | 11.1 | 12.2 |
| EPS (adj.) | 0.51 | 0.43 | 0.13 | 0.35 | 0.45 | 0.55 | 0.63 | 0.69 |
| growth-% | 174.7 % | -15.4 % | -70.0 % | 169.9 % | 29.3 % | 23.1 % | 12.9 % | 9.5 % |
| Dividend | 0.00 | 0.18 | 0.11 | 0.21 | 0.25 | 0.29 | 0.35 | 0.36 |
| Dividend ratio | 53.0 % | 92.2 % | 54.1 % | 55.5 % | 52.3 % | 56.0 % | 52.5 % |
Profitability and return on capital
| 2020 | 2021 | 2022 | 2023 | 2024e | 2025e | 2026e | 2027e | |
|---|---|---|---|---|---|---|---|---|
| EBITDA-% | 21.8 % | 14.9 % | 11.0 % | 17.3 % | 17.6 % | 18.8 % | 18.9 % | 18.8 % |
| EBIT-% (adj.) | 17.0 % | 12.3 % | 6.4 % | 11.7 % | 13.1 % | 14.2 % | 14.6 % | 14.7 % |
| EBIT-% | 16.2 % | 10.4 % | 6.2 % | 12.5 % | 13.1 % | 14.2 % | 14.6 % | 14.7 % |
| ROE | 49.0 % | 24.7 % | 6.9 % | 21.5 % | 21.9 % | 23.8 % | 23.6 % | 22.9 % |
| ROI | 20.2 % | 13.9 % | 7.5 % | 16.0 % | 17.7 % | 20.5 % | 22.0 % | 22.9 % |
Valuation
| 2020 | 2021 | 2022 | 2023 | 2024e | 2025e | 2026e | 2027e | |
|---|---|---|---|---|---|---|---|---|
| Share price (EUR) | 11.04 | 4.68 | 5.40 | 6.70 | 6.70 | 6.70 | 6.70 | |
| Shares | 16.3 | 17.8 | 17.8 | 17.8 | 17.8 | 17.8 | 17.8 | 17.8 |
| Market cap | 196.1 | 83.0 | 95.9 | 119.0 | 119.0 | 119.0 | 119.0 | |
| Enterprise value | 221.9 | 109.1 | 118.2 | 135.8 | 131.8 | 126.6 | 121.6 | |
| EV/S | - | 2.5 | 1.3 | 1.4 | 1.5 | 1.3 | 1.2 | 1.1 |
| EV/EBITDA | - | 16.8 | 11.8 | 7.9 | 8.5 | 7.2 | 6.4 | 5.8 |
| EV/EBIT (adj.) | - | 20.4 | 20.3 | 11.8 | 11.4 | 9.5 | 8.3 | 7.5 |
| EV/EBIT | - | 24.0 | 21.0 | 11.0 | 11.4 | 9.5 | 8.3 | 7.5 |
| P/E (adj.) | - | 25.6 | 36.2 | 15.5 | 14.9 | 12.1 | 10.7 | 9.8 |
| P/E | - | 32.5 | 39.2 | 13.9 | 14.9 | 12.1 | 10.7 | 9.8 |
| P/B | - | 6.2 | 2.8 | 2.8 | 3.1 | 2.7 | 2.4 | 2.1 |
| P/S | - | 2.2 | 1.0 | 1.1 | 1.3 | 1.2 | 1.1 | 1.1 |
| Dividend yield | 1.6 % | 2.4 % | 3.9 % | 3.7 % | 4.3 % | 5.2 % | 5.4 % | |
| Equity ratio | 22.6 % | 35.8 % | 36.3 % | 40.3 % | 46.9 % | 51.4 % | 56.6 % | 61.5 % |
| Gearing ratio | 228.4 % | 81.4 % | 87.6 % | 64.8 % | 43.5 % | 29.1 % | 15.3 % | 4.6 % |
Quarter data
| Q2/23 | Q3/23 | Q4/23 | 2023 | Q1/24 | Q2/24e | Q3/24e | Q4/24e | 2024e | |
|---|---|---|---|---|---|---|---|---|---|
| Revenue | 20.1 | 21.9 | 23.4 | 85.9 | 22.0 | 21.5 | 23.6 | 24.1 | 91.1 |
| EBITDA | 3.1 | 4.6 | 3.9 | 14.9 | 3.8 | 2.8 | 5.0 | 4.4 | 16.1 |
| EBIT | 2.1 | 3.5 | 2.9 | 10.8 | 2.8 | 1.8 | 4.0 | 3.4 | 11.9 |
| Profit before taxes | 1.3 | 3.2 | 2.3 | 8.5 | 2.1 | 1.4 | 3.6 | 3.1 | 10.2 |
| Net income | 1.1 | 2.4 | 2.1 | 6.9 | 1.6 | 1.1 | 2.9 | 2.4 | 8.0 |
ShowingAll content types
Orthex Oyj: Orthex Corporation: Managers' Transactions - Nicholas Ledin
Orthex Oyj: Orthex Corporation: Managers' Transactions - Hans Cronquist
Join Inderes community
Don't miss out - create an account and get all the possible benefits
Inderes account
Followings and notifications on followed companies
Analyst comments and recommendations
Stock comparison tool & other popular tools
Story unfolds as scripted

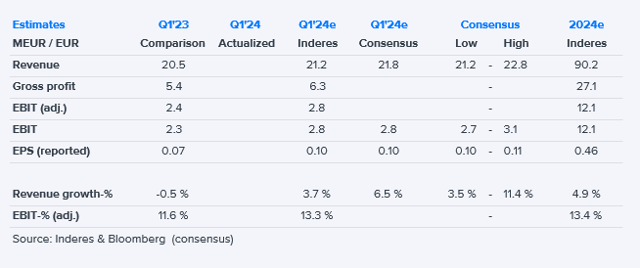
Orthex, Q1, 2024
Orthex Oyj: Orthex Corporation: Interim Report January-March 2024
Orthex Q1 on Wednesday: Demand slump over, but environment remains subdued
Orthex Oyj: Orthex will publish its Interim Report for January−March 2024 on Wednesday, 15 May 2024
Orthex: Growth efforts will eventually bear fruit
Orthex Oyj: Orthex Corporation: Updated financial reporting schedule in 2024
Orthex Oyj: Orthex Corporation: Sanna Suvanto-Harsaae continues to chair the company's Board of Directors
Orthex Oyj: Orthex Corporation: Resolutions of the Annual General Meeting 2024

Consumer Goods and Services Night | Tuesday, Jun. 11 at 4:00 pm EESTe
Orthex Oyj: Orthex Corporation: Managers' Transactions - Tom Ståhlberg
Analyst Group: Analyst Group intervjuar Orthex VD Alexander Rosenlew
Orthex Oyj: Orthex Corporation: Managers' Transactions - (Rosenlew)
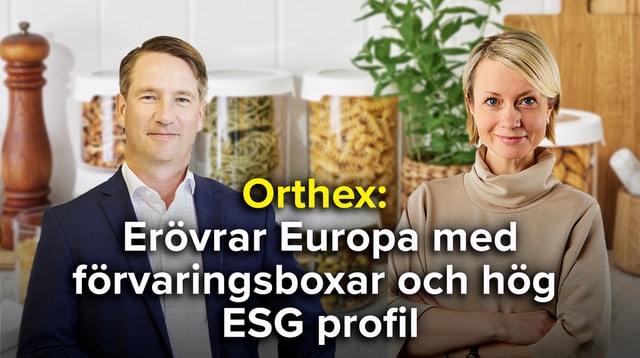
Orthex erövrar Europa med förvaringsboxar och hög ESG profil
Orthex Oyj: Orthex Corporation: Annual and Sustainability Report 2023 published
Orthex Oyj: Orthex's Sustainability Report 2023 published: Strong commitment to our sustainability targets