Aiforia Technologies

3,77EUR −2,08 %
766 investerare följer bolaget.

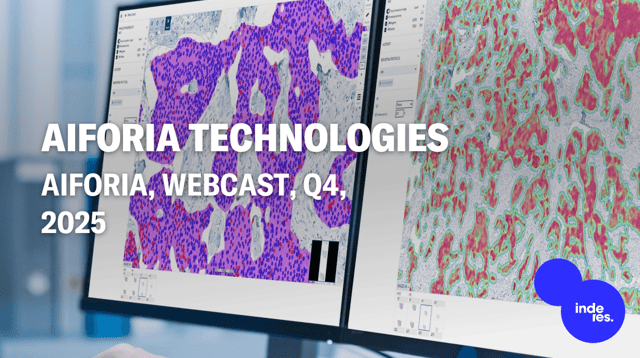
Aiforia Technologies utrustar patologer och forskare i prekliniska och kliniska laboratorier med programvara för att översätta bilder till upptäckter, beslut och diagnoser. Bolagets produkter och tjänster används för medicinsk bildanalys, över en mängd olika områden från onkologi till neurovetenskap. Aiforia Technologies har sitt huvudkontor i Finland.

P/E (23e)
−8,56
EV/EBIT (23e)
−8,06
P/B (23e)
5,44
Direktavkastnings- % (23e)
-
Riktkurs
4.80 EUR
Rekommendation
Öka
Uppdaterad
2.3.2023
First North Finland
AIFORIA
Dagens lägsta / högsta pris
3,71 / 3,89 EUR
Börsvärde
97,81 mn EUR
Omsättning
11,74 tn EUR
Volym
3,1 tn
Risk och rekommendation
HögRiskLåg
SäljRekommendationKöp

Resultaträkning

20192020202120222023e2024e2025e2026e
Omsättning0,640,850,971,874,228,5816,5228,57
tillväxt-%134,93 %32,86 %14,72 %91,79 %125,89 %103,27 %92,60 %72,95 %
EBITDA−2,14−1,61−3,45−8,11−8,11−6,16−0,986,25
EBIT−3,02−2,63−4,69−10,20−11,16−11,48−7,59−1,58
Vinst före skatt−3,05−2,76−7,58−10,61−11,38−11,72−7,89−1,88
Nettoresultat−3,05−2,76−7,58−10,61−11,38−11,72−7,89−1,88
EPS−0,15−0,14−0,29−0,41−0,44−0,44−0,28−0,07
tillväxt-%
Utdelning0,000,000,000,000,000,000,000,00
Utdelningskvot

Lönsamhet och avkastning på kapital

20192020202120222023e2024e2025e2026e
EBITDA-%−335,05 %−189,75 %−354,21 %−434,10 %−192,11 %−71,80 %−5,91 %21,88 %
EBIT-%−472,93 %−310,13 %−481,42 %−546,20 %−264,41 %−133,85 %−45,97 %−5,53 %
ROE−147,62 %−386,27 %−39,11 %−31,60 %−48,21 %−94,32 %−192,42 %−588,24 %
ROI−78,85 %−77,00 %−20,92 %−28,06 %−43,01 %−73,52 %−68,18 %−15,02 %

Värdering

20192020202120222023e2024e2025e2026e
Pris per aktie (EUR)5,223,233,773,773,773,77
Aktier19,9719,9725,7825,8325,8326,8328,4328,43
Börsvärde134,5783,4297,37101,14107,17107,17
Rörelsevärde99,3761,4189,97105,51116,87117,87
EV/S--102,0232,8821,3212,307,074,13
EV/EBITDA-------18,86
EV/EBIT--------
EV/EBIT--------
P/E (just.)--------
P/E--------
P/B--3,562,855,4414,5685,08-
P/S--138,1644,6623,0811,796,493,75
Direktavkastning
Soliditet12,77 %16,82 %86,28 %82,88 %72,77 %38,12 %6,13 %−2,72 %
Gearing ratio127,73 %146,05 %−93,00 %−75,15 %−41,29 %62,99 %769,83 %−1 725,50 %

Quarter data

Q1/22Q2/22Q3/22Q4/222022Q1/23eQ2/23eQ3/23eQ4/23e
Omsättning0,731,141,871,722,50
EBITDA−3,51−4,60−8,11−4,27−3,84
EBIT−4,39−5,81−10,20−5,57−5,59
Vinst före skatt−4,38−6,23−10,61−5,68−5,70
Nettoresultat−4,38−6,23−10,61−5,68−5,70
Publisher
BioSnack: Wish list for BioTech and Life Science investors

Welcome to this special Christmas edition of our BioSnack newsletter from HC Andersen Capital where we will try and give you insights and perspectives on the fascinating world of BioTech and Life Science investing – and perhaps try and spread a little bit of Christmas spirit. In this addition we have added a christmas wish list for BioTech and Life Science investors. On behalf of our BioTech and Life Science team, we hope you enjoy the reading!

Analytikerkommentar2022-12-19 av Oliver Bronze, Henrik Ekman, Claus Thestrup