Incap operates in the industrial sector. The company supplies equipment and services for industrial players, where the range includes PCB assembly, system integration, box building integration, design validation, and inspection methods. The largest operations are found in the Nordic, Baltic and Asian regions. The company was originally established in 1985 and is headquartered in Helsinki.
Organic growth was above our Q2 forecast, but the company has recently faced some profitability issues. Part of the declining EBITA margin can be explained by the Lacon acquisition. At the same time, competition in India has also intensified. In addition...
Incap's Q2 was operationally in line with the estimates that had been lowered after last week's profit warning. The report also did not indicate that the margin pressure mentioned in the company's profit warning would be a temporary factor, as its root cause is likely increased competition in India.
Profitability (adj. EBITA margin) was weaker than we forecasted for Q2. An unfavourable sales mix weighed on Q2 profitability. Component availability was also problem in Q2, which could have raised input costs. But organic growth was slightly above our...
We downgrade our full-year 2026 EBIT forecast by 10% due to the profit warning issued on 24 July. The company expects revenue of EUR 270-290m in 2026, while the new adjusted EBITA guidance is EUR 26-29m. The share price dropped 14% on the day of the ...
We cut our Incap target price to EUR 9.00 (previously EUR 12.00) due to significant negative estimate revisions following the profit warning issued by the company on Friday and an increase in the required return. However, we reiterate our Accumulate recommendation for the share, as its valuation has been trampled to a very low level despite the estimate cuts. Incap will publish its Q2 report on Thursday, July 30.
Incap confirmed its FY2026 net sales growth guidance but downgraded its EBITA guidance. The company expects revenue of EUR 270–290m in 2026 (consensus: EUR 282m), while the new adjusted EBITA guidance is EUR 26–29m. We calculate that the midpoint of ...
Incap delivers cable harnesses and electromechanical assemblies for the Leopard tank under a three-year contract. The EUR 11m order from KNDS represents 1.2% increase in annual net sales. Incap also expects the order volumes to be extended for additional...
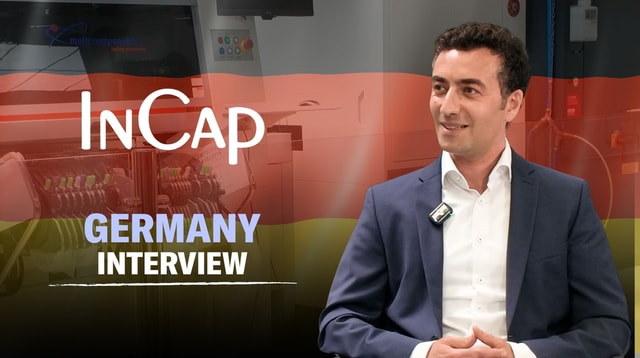
We visited Incap's factory in Karlsfeld, Germany, and got a look at the operations and production at the plant. Antti Viljakainen interviews Afrem Alfia, Managing Director of Operations at Incap's German factory.