-0.39 %
+0.78 %
+1.57 %
-5.66 %
-1.90 %
+2.38 %
+33.66 %
-33.63 %
-47.54 %
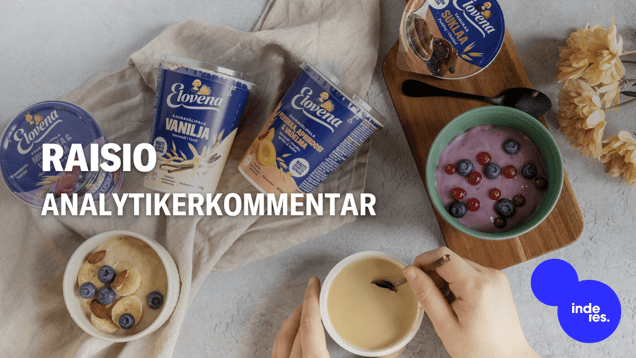
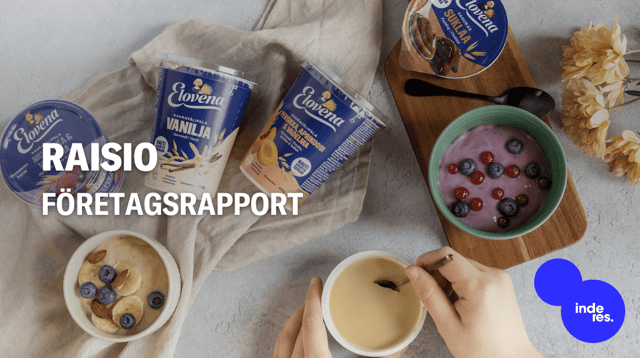
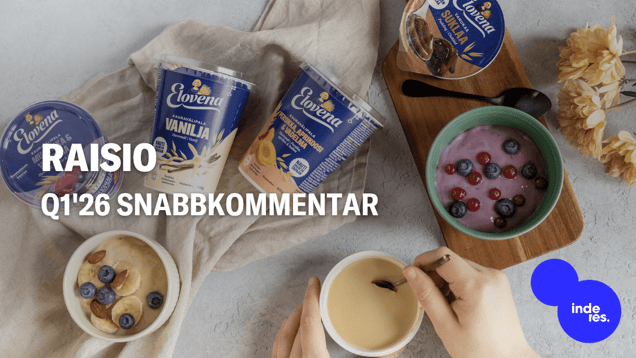
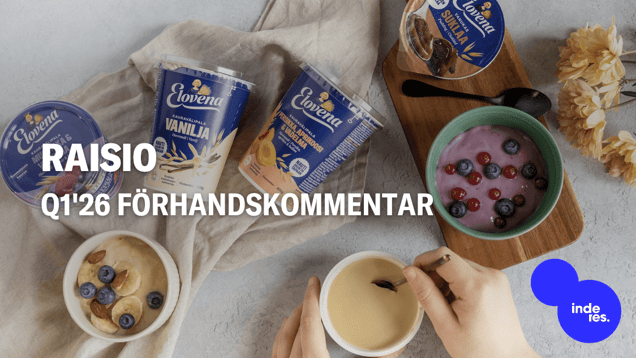
Raisio is an international food company that develops and produces foods that promote healthier eating habits. The products are sold under various brands, such as Benecol®, Elovena®, Torino®, Sunnuntai® and Nalle®. Raisio’s key markets include Finland, the United Kingdom, Ireland and Poland, and the company is expanding into selected European markets. The company was founded in 1939 and has its headquarters in Raisio, Finland.
Read moreMarket cap
411.46M EUR
Turnover
66.44K EUR
P/E (adj.) (26e)
16
EV/EBIT (adj.) (26e)
11.13
P/B (26e)
1.59
EV/S (26e)
1.46
Dividend yield-% (26e)
6.19 %

Latest research
Latest analysis report
Released: 2026-05-13