Titanium operates in the financial services industry. The group offers a wide range of financial services, mainly in asset management, loan financing and pensions. The group also manages a number of investment funds and structured financial products. Titanium was originally founded in 2009 and is headquartered in Helsinki.
Titaniums H2-rapport innehöll inga större överraskningar och den stora bilden förblir oförändrad. Inom fastighetsfonder är situationen svår och pressen att lyckas med kapitalförvaltningen är hög.
Helsingforsbörsens direktavkastning förväntas minska från jämförelseperioden. Utdelningssänkningar är att vänta, men hög direktavkastning finns också tillgänglig från utvalda företag.
Inlösen från fastighetsfonder verkar vara större än våra förväntningar, och till följd av detta kommer resultatgropen under de närmaste åren att bli djupare än tidigare. Företagets press att lyckas med den nya kapitalförvaltningstjänsten är stor på grund av fastighetsfondernas utmaningar. Om kapitalförvaltningen lyckas expandera finns det en tydlig potential i aktien, men för närvarande väger riskerna betydligt tyngre.
Titaniums månadsrapporter gav denna gång exceptionellt mycket information. Rapporten konkretiserade omfattningen av inlösen av fastighetsfonder och lanseringen av kapitalförvaltningstjänsten. Det verkar som om det kommer att bli fler inlösen i fastighetsfonderna än vi ursprungligen uppskattade. Samtidigt har dock PE-fonden fortsatt sin goda försäljning och kapitalförvaltningstjänsten verkar ha kommit igång positivt. Detta är naturligtvis oerhört viktigt, eftersom den resultatnedgång som fastighetsfondsinlösen orsakar verkar bli ännu djupare än vad vi ursprungligen förväntade oss. Vår omfattande analys som publicerades i somras kan läsas här.
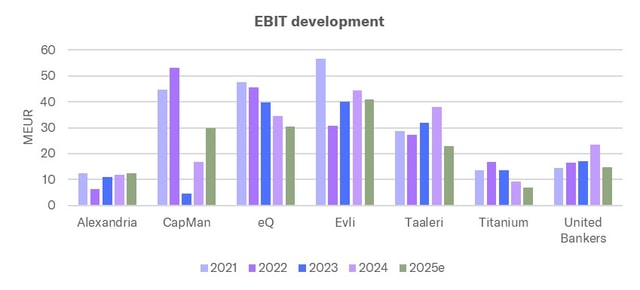
For asset managers on Nasdaq Helsinki, the trend has been mixed. The market situation has been very challenging for operators focusing on alternative investments, particularly real estate, while traditional asset management has continued to grow strongly.
For financial companies, 2025 has been very positive in terms of the operating environment, with strong capital market development and stabilized interest rates. However, the performance of the companies has been varying, and many companies we follow have suffered particularly from the subdued development of alternative investment returns (new sales and performance fees).
Titaniums nyförsäljning var måttlig i november och PE-fonden fortsatte sin positiva utveckling. Ingen ny information erhölls om betalningen av de försenade inlösen från Vårdfastigheterfonden. Vidare lanserade företaget officiellt sin nya kapitalförvaltningsmodell. Det ska bli intressant att se hur företagets kunder tar emot den nya kapitalförvaltningsmodellen, eftersom kapitalförvaltningen är tänkt att vara företagets andra tillväxtpelare under de kommande åren. Försäljningen av fonderna är i stort sett i linje med våra förväntningar och orsakar inga estimatrevideringar. Vår omfattande analysen som publicerades i somras kan läsas här.
Titanium meddelade på onsdagen att dess VD Walter Ahlström omedelbart lämnar sin post för att återgå till sin tidigare arbetsgivare. Avgången kommer vid en dålig tidpunkt för Titanium och vi ser det som en förlust för företaget. För Titanium är en snabb rekryteringsprocess av yttersta vikt för att implementeringen av den nya strategin ska störas så lite som möjligt.
Titanium publicerade sina månadsrapporter för oktober, vilka indikerar att nyförsäljningen fortsatte den positiva utvecklingen som sågs i september. Det rapporterade nettoinflödet var cirka 4 MEUR positivt, och dessutom meddelade företaget att det hade sålt PE-fonden för cirka 4 MEUR efter rapportperioden. Därmed verkar den positiva försäljningsutvecklingen fortsätta även i november. För hela året hittills ligger nivån fortfarande nära noll, men viktigare än detta anser vi vara den försäljningsvändning som började i höstas. Dessutom noterar vi att både Vårdfastigheterfond och Bostadsfonden har skjutit upp betalningen av sina inlösen, och företaget har enligt vår bedömning betydande inlösen i kö, särskilt i Vårdfastigheterfond. Vår omfattande analys som publicerades i somras kan läsas här.
Titanium publicerade sina månadsrapporter för september, och baserat på dessa sågs äntligen en länge väntad återhämtning i nyförsäljningen. Nettoinflödet var enligt våra beräkningar ungefär 10 MEUR på plussidan, drivet av PE-fonden. Detta lyfte hela årets försäljning till nära noll. Även om årets första resultat naturligtvis är svagt, är försäljningen i september uppmuntrande. Försäljningen av PE-fonden är fortfarande i ett tidigt skede, och man bör inte dra för stora slutsatser med hänvisning till en enda månad. Dessutom noterar vi att både Vårdfastigheterfond och Bostadsfonden har skjutit upp betalningen av sina inlösen, och företaget har enligt vår bedömning betydande inlösen i kö, särskilt i Vårdfastigheterfond.
In this article, we review the quality of earnings of listed asset managers. In summary, the quality of earnings varies significantly within the sector, but on average, the level is quite good. The level has also improved in recent years, as the share of recurring fees has increased. We note that we have made the comparison at the group level, and thus the comparison does not account for the companies' differing business structures. We excluded Aktia from our review as the necessary information on its asset management is not available.